Putting aside the fact that I haven’t been invited yet, I wanted to know what impact one should expect from speaking at TED.
TED was introduced 3 decades ago but it was in 2006 that they began sharing their videos on the internet.
On their YouTube channel there are almost 2,000 videos. They have 3 million subscribers and till now they had more than 366 million views. TED’s owner, by the way, is no other than Chris Anderson, the founding father of the long tail theory.
TED’s slogan is “Ideas worth sharing”.
I wanted to see how the sharing works for the chosen ones who made it to the reputable TED podium.
It turns out that the most popular video on TED talk YouTube channel belongs to Tony Robbins, who spoke about “Why we do what we do“. His talk was published on June 2006 and reached almost 8 million views!
There is also one other talk that made more than 7 million views, 2 other talks that made more than 5 million, 6 that made more than 4 million, and altogether there were 61 talks till now that made more than 1 million views.
The other 1,823 talk didn’t reach 1 million.
Actually most of them didn’t even reach 20,000 views.
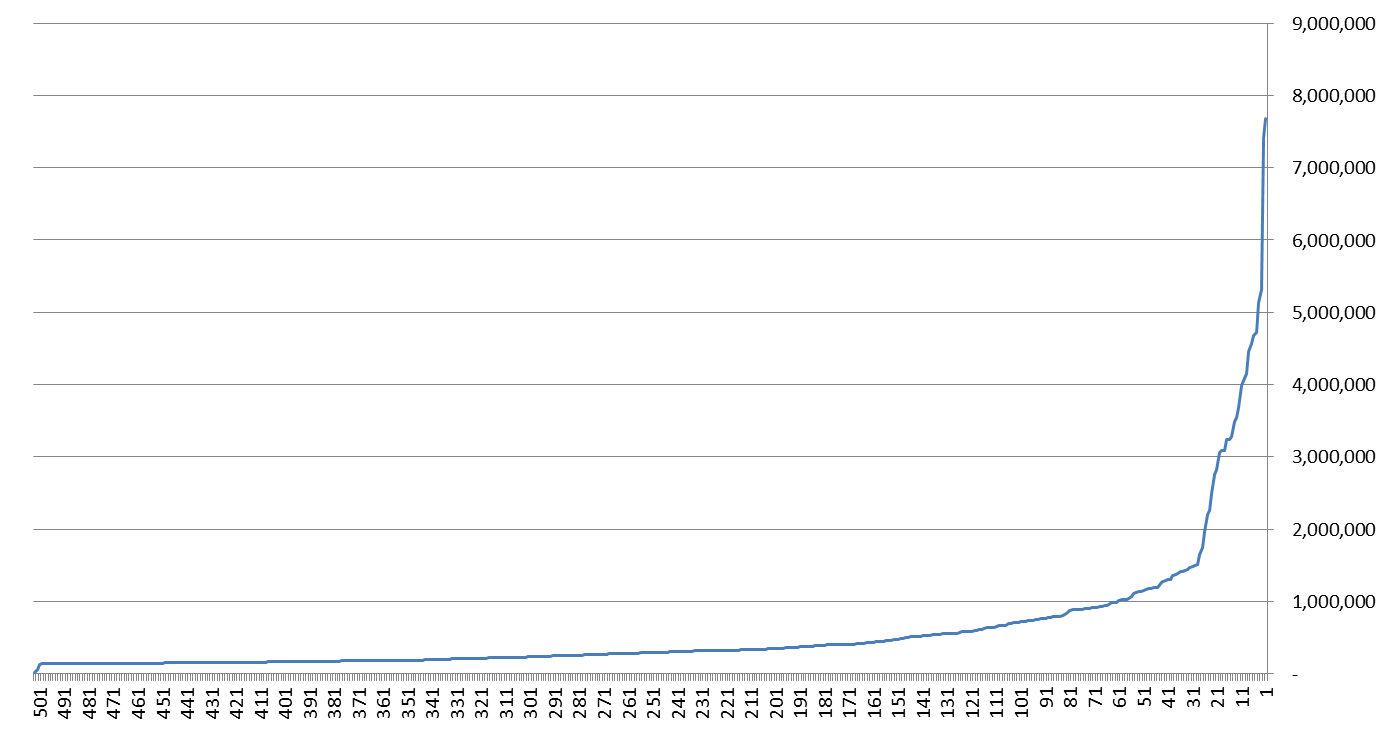
This is the curve of the 501 (out of 1,884) most popular TED talks on YouTube:
1% of the talks are responsible for more than 20% of the views.
5% of the talks are responsible for almost 50% of the views.
10% of the talks are responsible for 60%.
20% responsible for almost 75%.
27% responsible for 80% of the views.
It seems that although TED’s slogan is “Ideas worth sharing” there are some ideas that worth much more sharing than the others.
In other words the short head works also on TED speakers, just like it does on Music, movies, Apps and books. All of TED speakers are exquisite and carefully picked, but still, some of them, a small minority is much more popular than the rest.
Anyway… I don’t think I would say NO if I was invited.
If you want to hear me speak about the short head on your Podium, give me a call. I don’t mind doing long tail talks for now.
It is more like a walking dead – Still exists but doesn’t look good…
the walking dead
So we know by now that the short head is huge and that the long tail is long (walking) dead but the funny thing is that the walking dead long tail is one of the reasons for the short head phenomena.
We have talked about the 2 main reasons for the short head – (1) our nature – we are conformists and we like social proof for the things we do, eat, buy or watch, (2) social media has increased the numbers of interactions that we individuals have each and every day and by doing that it speeds the process of adopting new stuff (I will elaborate in future posts).
The 3rd reason is the long tail itself.
When a long tail exists and confronts us with too many options to choose from, we tend to say – “you know what? I will just stick with that first one you showed me”.
We don’t have the time, the know-how or the expertise to choose differently. We feel smaller and less secure because there is no chance that we can clearly make a good decision with all these alternatives. Suddenly we are not even sure about our own taste anymore.
The Simpsons – Monstromart
If there are so many B&B options in the French Riviera the chances of choosing a bad one for our vacation is huge and therefor there is a big risk perception. We don’t like risk. We prefer to let someone else decide for us. That way we also don’t blame ourselves if we are not pleased with what we got.
That is why we download the first flashlight App we find on the App store search results, make reservations in the most popular and recommended restaurants and hotels, choose the same popular T-shirt designs, watch the same YouTube videos etc.
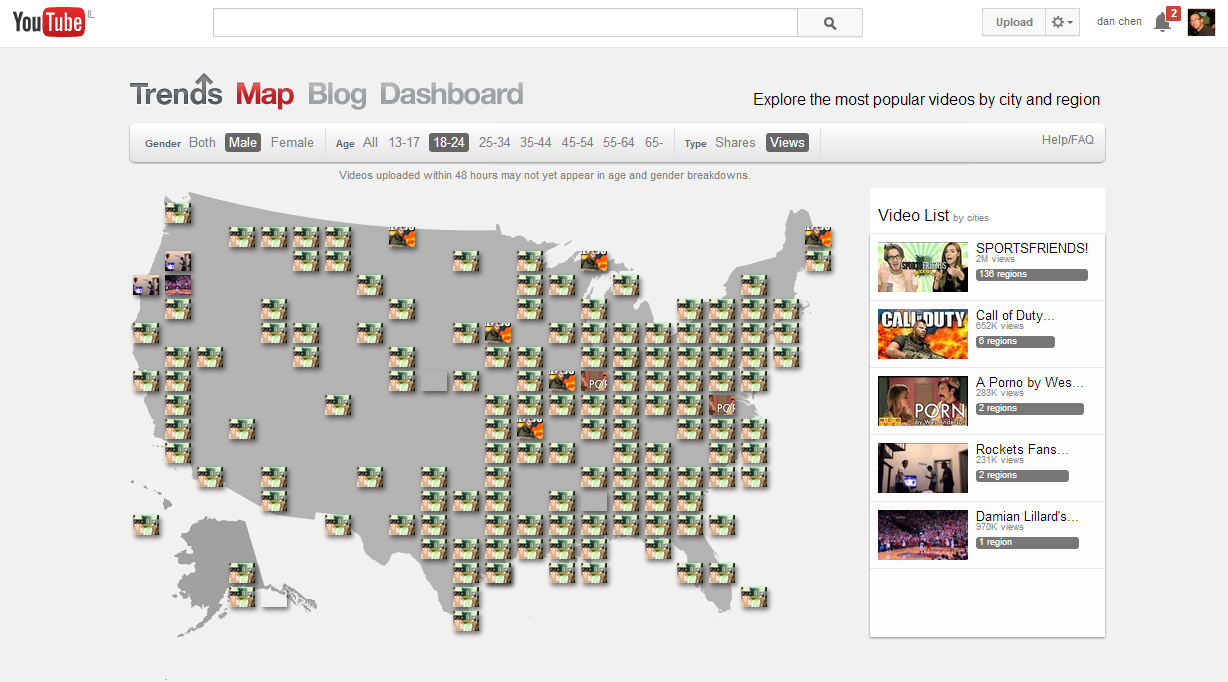
Let’s see what is the most popular video on YouTube right now among 18-24 years old males in NY.
This is the answer:
Now lets see what is the most popular video on YouTube right now in the US in general:
it is the same… not just in NY.
It is everywhere as you can see on YouTube trends map:
Barry Schwartz who explores how we deal with many choices says in his book, The Paradox of Choice: “Choice no longer liberates, but debilitates. It might even be said to tyrannize…. the fact that some choice is good doesn’t necessarily mean that more choice is better.”
“The digital generation is picking, and not choosing… With a world of choices rushing by like a music video,” he continues, “all a picker can do is grab this or that and hope for the best.”
The jam example
Sheena Iyengar, a professor of business at Columbia University and the author of “The Art of Choosing” conducted a very interesting experiment to see how people react when they have too many options.
She set up a booth of samples of Wilkin & Sons jams in a big gourmet Supermarket in California. Every few hours, she switched from offering a selection of 6 jams to a group of 24 jams.
The results were interesting:
60% of customers were drawn to the large assortment, while only 40% stopped by the small one, and in both cases the customers tasted two jams on average.
30% of those who had sampled from the small assortment actually bought jam, while only 3% of those confronted with the 24 jams assortment purchased a jar.
“The presence of choice might be appealing as a theory,” said Professor Iyengar, “but in reality, people might find more and more choice to actually be debilitating.”
In her book, Sheena Iyengar gives examples for companies who have shortened their long tail in order to become less confusing for shoppers. Glidden, an American paint brand, reduced its colors palette in 2009 from 1,000 to a 282 because of a change in “Americans’ priorities from ‘more is better’ to ‘less is more’”.
Procter & Gamble, the American consumer-products company, killed 9 Head & Shoulders shampoos (they went from 26 to 15). The result was an increase of 10% in sales.
When you enter L’Astrance, a three-star Michelin restaurant in Paris, don’t ask for the menu – they don’t have one – the chef Pascal Barbot produces a different ‘surprise menu’ at each sitting.
May the short head be with you!
The short head is reliable and it is there for you
The more that options multiply and the tail gets longer, the stiffer and taller the short head becomes. The consumers seek something that others trust. That something is a short head winner and it is getting bigger and bigger as they continue buying it.
There are many good reasons why the apps market reinforces the short head theory or as some say it is an “anti long tail“.
The average smartphone user downloads 25 apps. He chooses them from a variety of more than 1 million apps. When the possibilities are so huge we tend to be more conformists and pick what the others have already picked. Really now, how else can we chose the best 25 out of a million?
Among those 25 apps there are always some utilities such as a flashlight, a weather app, a calendar, a music app etc., and the truth is that we are quite Indifferent to which one we download.
We just take the first in the list. The first in the list is usually the most popular one and this mechanism will keep it there until it becomes the short head big time winner in his category.
There is another way to be first in a list and I mean the “editor’s choice” or “top 25” list. The thing is that 99.95% of the apps never make it to these lists and therefor find it almost impossible to get noticed or discovered (based on a study by Appsfire).
What does Word of mouth have to do with it?
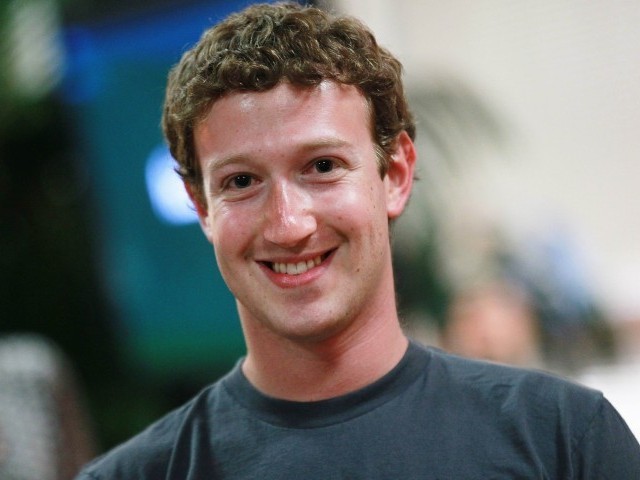
On June 2012 Mark Zuckerberg posted on Facebook that “Song Pop is one of the most fun Facebook games I’ve played in a while”.
Mark has almost 30 million followers on Facebook so when he shares a post it appears on many Facebook walls.
The impact of his post on the “Song Pop” app was amazing and within several days it reached 5.9 million active users (according to AppData).
This is an extreme example of how the combination of word of mouth, opinion leader and social media, speed the adoption of stuff (an app in this case).
Since there are not many stores that sell apps (that is an understatement – there are 2 stores really but only one is relevant to you based on the phone that you carry), and those that are selling it don’t offer the best experience for discovering good apps, there is another popular way we discover apps – our friends and social networks.
We see them share their 2048 game score, offer us mix tapes that they created on 8tracks, ask us to help them on Candy crush or in general talk about their favorite apps.
The app developers know that they can’t rely on the app stores to help them get discovered and work hard on being “viral” by adding viral elements to their apps.
Relying on “viral” and boosting word of mouth elements accelerate the short head economy as we have learned before.
Another question that we might need to ask is why don’t we download more than 25 apps? After all most of the apps are free so there is no real risk in downloading it, it doesn’t require us to go somewhere.it is easy. Why then?
Remember we talked about the short head of T-shirts? Although there is a big catalogue of great designs, at the end of the day, the day has 24 hours and we don’t want to spend them all browsing at t-shirt catalogues.
Same goes to apps. How much time do we want to spend in App stores? How many flashlights or music apps do we want to explore or use? We do have better things to do with our time and phone. We have 25 great apps that we can play with.
how to make 35 million downloads in 7 weeks / The good news part (and the new rule of the short head)
After burning 17 million dollars on the development of several Apps that didn’t do very well on the App stores, the games developer OMGPOP took its last chance and dollars and put it all on developing a game called “Draw something”, a Pictionary like game. This is what they call in poker “all in”.
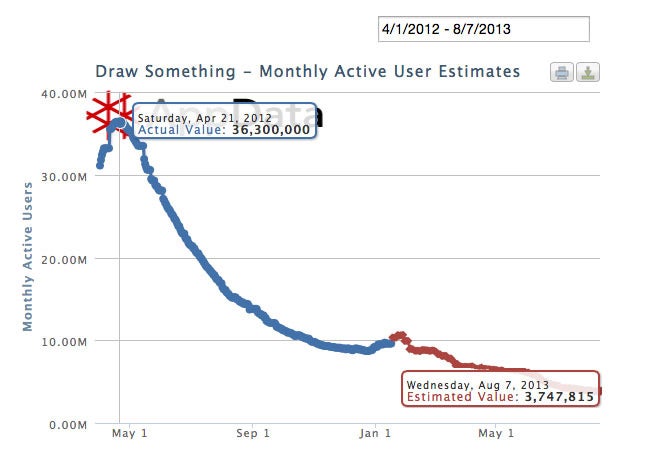
The game was released on Feb 2012 and became a huge success almost overnight, reaching 35 million downloads in less than 2 months.
“Six weeks ago, we released this game and it has been an incredible and wild ride since,” said Dan Porter, the CEO of OMGPOP, “What’s exciting for us is that this is a game that people of all ages and all over the world have been playing.”.
On March 21th Zynga bought the company for 210 million dollars.
2 weeks later, on April 4th they had more than 14 million daily users.
This brings us to the 9th rule of the short head – Everybody can become short head winners. Not just the big studios or those who have done it before.
Here are another 2 great examples:
“Angry birds” is probably one of the most popular games ever. It was launched on December 2009 and soon became a number one hit with more than 2 billion downloads so far. What I don’t think you know is that Rovio, the studio that created it, released 51 games before “Angry birds”, which you probably haven’t heard of any of.
2048, the current blockbuster game in the App stores, is actually a clone of a game called “Threes” that was released few weeks earlier but wasn’t really discovered.
Luck is another way of looking at it, or as Matt Coombe fairly admitted: “A huge amount of the App Store is luck. We know when we got there with ”Mega Jump“ it was luck, we didn’t know the game was going to be a hit.”. other developers call it “App Store Roulette,” The odds are against you and the chances are worse than winning the lottery but if you do succeed you can win the jackpot.
You can ask 17 years old, Nick D’Aloisio, Jan Koum, Brian Acton or Evan Spiegel.
The first sold his App, Summly, to Yahoo! For 33M$, the second and the third sold their App, Whatsup, to Facebook for 19 billion dollars and the fourth said “NO” to Facebook who offered him 3 billion dollars for his App, SnapChat.
Are we done already? / What does the “short” in “the short head” stand for? (a short epilogue)
Lets get back to “Draw something”.
From the peak of 14 million daily users at the beginning of April, “Draw something” experienced a slippery downhill. The ride became wilder.
By the end of April they had only 10 million daily active users (a decrease of 30%) and the numbers continued going down real fast.Dismiss
This brings us to the 10th rule of the short head, which also answers the question why do we call it the short head rather than the “tall head” – the short head usually doesn’t last long… enjoy it while it is there.
If you don’t read this post till the end your App will probably get less than 1,000 downloads. if you do read it and get also a little help from the cosmos, there is a chance that you will be among the very few short head winners of the App store and stay there for eternity (mmm… a couple of weeks more likely).
A few days ago we were invited to a big family dinner. During the evening I noticed that 4 guests were playing the same game on their smartphones. It turns out they were not the only ones. There were at least 10 million others who were playing the same game at that time. For me it was the time to start exploring the short head of mobile Apps.
2048
So they say there is a long tail of Apps, and they are right.
There are already more than one million Apps for iPhone and android on the App store and on Google play and it is getting bigger and bigger. There are also more than 300,000 different developers who have uploaded Apps to these platforms and people spend a lot of money buying Apps (I phone users alone spend 10 billion dollars a year in the App store).
So there is a long tail but does it work? (If you have been following my blog you probably know the answer which is based on the 2nd and 4th rules of the short head).
The short head of downloads
In order to try to understand how the long tail works or doesn’t work in the App market I looked at the stats on Appbrain, which explores only android apps downloads, and did some additional calculation based on several assumptions.
According to Appbrain this is how android App downloads is distributed:
430,000 apps were downloaded less than 100 times.
304,000 apps were downloaded less than 1000 times.
255,000 apps were downloaded less than 10K times.
156,000 apps were downloaded less than 100K times.
38,000 apps were downloaded less than 500K times.
7,000 apps were downloaded less than 1M times.
8,500 apps were downloaded more than 1M times.
the distribution of App downloads
It means that most apps (734,000) don’t reach more than 1,000 downloads. That a bummer.
But wait a minute. Don’t be so negative. This chart also shows that there are more than 200,000 different apps that got more than 10,000 download. Not bad. It seems that not only the head is big but also the body. But is it really?
Let’s look deeper into the head – We are talking about 8,500 apps that got more than 1M downloads, among them you can find a few that got more than 500M like Facebook, Whatsup, Youtube, Gmail and Google maps, and some that got more than 100M like viber, instagram, candy crash, skype, subway surfers, facebook messenger, tiny flashlight, fruit ninja, twitter and chrome.
If we try to calculate how many cumulative downloads those 8,500 short head apps have altogether we can assume the number is around 25 million (an average of 3M per app).
In that case the demand chart looks something like this:
the short head of App downloads
0.1% of the apps generate almost 50% of the downloads.
4.5% of the apps generate 80% of the downloads.
17.5% of the apps generate 97% of the downloads.
The remaining long tail apps (82.5% of the apps) share the 3% leftovers.
I was still not convinced that my assumptions were right so I added information I got from digitalinspiration.com, a list of the top Android Apps that have reached more than 50,000,000 downloads on the official Google Play store. It is not current stats but it still offers a better understanding of how the short head splits.
Their list shows this distribution:
5 apps have more than 500M,
24 have more than 100M,
36 have more than 50M
and 250 have more than 10M.
When adding that info into the chart we see that the curve becomes even more short headed:
the shorter head of Apps downloads
Now it seems like 4.5% of the apps get 86% of the downloads.
The remaining 95.5% of the apps get only 14%.
That’s a short head, not like in the movies but still impressive.
We see the same short head behaviour in terms of active users. At the earlier days of the app store, in May 2009 to be more specific, Admob (the ad exchange for mobile which was later on bought by Google) published their monthly statistical report of the apps in its ad network.
Their findings were that most apps had less than 1,000 monthly active users. 27% had between 1K to 10K active users each month, 14% had more than 10K and less than 100K, 4.5% had more than 100K active users, and 0.5% had more than 1M.
That is quite of a short head in terms of active users or as mashable said in their headline back then “Apple App Store: Overpopulated with Apps Nobody Uses”.
Your app will get you rich! just like gold mining would
So there is a short head in terms of downloads and usage, but the short head economy is interested also in terms of revenues.
The apps business is based on 2 major revenue sources – money from users (paid apps and freemium apps) and money from advertisers (free apps with ads).
A Gigaom pro report from 2012 based on a survey of 352 app developers confirmed that there is short head in apps ad revenues when it found that almost 40% of Apps earned less than 100$ per month from ads, another 30% earned more than 100$ but less than 500$ per month.
2% earned more than 20,000$ but they earned so much more than 20,000$ that despite the small size of their group (only 2%) and the fact that the majority of the apps earned less than 500$ per month, the average of the monthly revenues for apps stood on 1,588$.
When it comes to paid apps it is even worse – almost 60% of the paid apps earned less than 500$ per month, 20% of the apps generated thousands of dollars per month and less than 4% earned more than 20K$.
The future was wide open (Tom Petty) – will it?
Mega Jump by Get Set Games Inc – more than 10M androids downloads
“Think again before quitting your day job”, said Matt Coombe, co-founder of the Toronto-based app development company Get Set Games in an interview a few weeks ago.
“In the early days it was basically if you could make a decent app and get it out on the App Store you had a very good chance for success. You wouldn’t necessarily become a millionaire overnight but you could make a decent salary for yourself…I think those days are over because there’s so much quality out there.”
“It’s very difficult to stay high on the charts in the App Store and it’s very hard to know why or how,” Coombe says.
So the present looks worse than the past but the future looks even worse.
Gartner released a new report in January 2014 saying that less than 0.01 Percent of Consumer Mobile Apps Will Be Considered a Financial Success by Their Developers Through 2018.
“The vast number of mobile apps may imply that mobile is a new revenue stream that will bring riches to many,” said Ken Dulaney, VP and analyst at Gartner. “However, our analysis shows that most mobile applications are not generating profits and that many mobile apps are not designed to generate revenue, but rather are used to build brand recognition and product awareness or are just for fun. Application designers who do not recognize this may find profits elusive.”
I tried to postpone it but I guess it is time to start talking mathematics and dive into the Bass diffusion model in order to understand why the short head economy is happening. Therefor this post requires you to be focused and concentrated.
As said before the Bass diffusion model is a mathematical model that describes the “Diffusion of innovations”.
This is the Bass model principal:
These are the variables of the equation:
f(t) – The portion of the potential market that adopts the new product at time t.
F(t) – The portion of the potential market that have adopted up to and including time t.
a(t) – Adopters (or adoptions) at t.
A(t) – Cumulative adopters (or adoptions) at t.
And these are the parameters (coefficients):
M – The potential market (the ultimate number of adopters).
p – Coefficient of innovation (external influence such as PR, advertising etc.).
q – Coefficient of imitation (internal influence – interactions between adopters and potential adopters in the social system).
Another way to look at it is this:
The graph of a(t) looks like this:
The number of adopters at time t
From the graph we can see the importance of the word of mouth influence (q). The flat blue line presents a case where there is no internal influence (meaning that the word of mouth doesn’t work at all)…
Let’s take a look at the Cumulative adopters graph (A):
The number of Cumulative adopters at time t
As you can see, p (the external influence like advertising and PR) mostly affects the starting time of the adoption. q, the internal influence meaning the word of mouth) is the important parameter that influences the adoption and sales.
Here are another 2 examples:
are you still with us? that great! Get some coffee and let’s carry on…
How do we predict the future of the new product?
Well, it’s easy. After we have the real data of several time periods we can calculate the coefficients (p, q and m).
After we know the coefficients we can put them in the equation and predict the future adoption of the product.
Here is an example of how the model worked in the past:
Eight Generations of DRAM Chips Actual and Fitted 1974-2000 / same p’s and q’s – Data from Gartner Dataquest
Now let’s go back to the original equation:
On the left side of the equation is the portion of the potential market that adopts at time t (f(t)) given that they have not yet adopted (1-F(t)). It is known as a hazard rate. It also presents the probability that someone will adopt the innovation in this time period, given that he has not yet adopted it.
For example – let’s say that 10% of the potential market have bought the new product at time X, and till now (altogether including time X) 30% of the potential market have purchased the product, the result would be: 10%/70% = 1/7 = 0.14. That is also the probability that someone who has not yet purchased the product would do so in this time period.
If another 10% of the potential market bought the new product at time Y, and till now (altogether including time Y) 80% have already purchased the product, the result would be: 10%/20% = 0.5. Again, that is also the probability that someone who has not yet bought the product would do so in this time period – 50%. He can be one of the 10% that will buy the product (out of the 20% that still haven’t) or one of the 10% who would still not buy (out of the 20%). The chances are even in this case.
The right side of the equation is linear with respect to the number of previous adopters and the variables.
So the chances that someone would buy the product are influenced by the variables and the number of previous adopters.
The chances for adoption are higher when q, p and the number of previous adopters are higher.
all we have to do now is check if anything happened to these coefficients in the last several years.
In 2011 28 baby girls were named Cataleya. In 2012 there were 636!
“The Cataleya orchid. It comes from one place on Earth. Our place. My mother, your grandmother, used to grow them. Every morning I would wake up to the sight of them. The smell of them. That’s why I named you after them. It reminds us of who we are.”
From the movie “COLOMBIANA”. Written by Robert Mark Kamen & Luc Besson.
In 2011 28 baby girls were named Cataleya.
In 2012 there were 636!
An increase of more than 2000%.
The movie Colombiana, whose main character was Cataleya, might have had something to do with it.
Names and trends in names have always been affected by famous actors and characters. Cataleya is just a recent example.
The U.S. Social Security Administration provides a list of new born baby’s names every year since 1885. They offer the data for researchers who look for trends in names or for people who are just bored in general.
We took the opportunity to check if girl name trends endorse the short head theory.
This is what we have found…
the short head of names 2012 – source: The Official Website of the U.S. Social Security Administration
The 10 most popular girl names (out of at least 19,380 different names that were given that year) in 2012 were given to almost 10% of the new born girls.
The 100 most popular names (0.5% of all the names on the list) were given to almost 35% of the girls.
The 250 most popular names (1.275% of all the different names) were given to 50% of the girls.
The 1,000 most popular names (5.16% of all the different names) were given to almost 75% of the girls.
The 2,000 most popular names (10.3% of all the names) were given to 82.6% of the girls.
The 4,000 most popular names (~20% of all the names) were given to ~90% of the girls.
That is a nice short head!
But what we also see is the tail is getting longer throughout the years and that the head is getting … shorter. In other words, “The Short Head” theory does apply here but it used to apply even more in the past.
For example – the most popular girl name in 2012 was Sophia. It was given to 22,156 baby girls (1.3% of the girls that were born in 2012). In 1982 the popular name was Jennifer. It was given to 57,102 girls! Almost 3.4% of the girls that were born that year were named Jennifer. In 1885 the most popular girls name was Mary, and it was given to almost 7% of the girls that year.
There were only 1197 different names on the list of the year 1885 (of girl names that were given to at least 5 different girls). Not much compared to the 12,300 names in 1985 and almost 20,000 names in 2012.
So we still see in 2012 a short head behavior but we also see that the tail grew longer and that the “hits” got shorter.
Why is that?
Well, it is about time you started contributing to this blog as well 🙂 Lets hear what you think.
“This year marks the 100th birthday of the T-shirt. Maybe” – Here is a site that doesn’t take itself too seriously. That’s cool with me; it is T-shirt we are talking about, not rocket science.
However, they do say in the article that 100 years ago, in 1913, the U.S. Navy ordered a light undershirt for sailors to wear under their uniforms. That brought tees into public consciousness.
But we don’t really need the allegedly 100 year’s celebration to check on the short head of T-shirts, do we? I just couldn’t keep that unimportant piece of information to myself.
Let’s talk about online t-shirt stores.
Apparently it should be a Long tail classic: No need to keep stocks on the shelves; the retailer can just print the desired design on the desired t-shirt the minute an online order gets in; the buyers can express themselves and chose niche designs that fit them… classic long tail logic.
But does it really work that way?
My first guess was that it doesn’t but I had to check. After all, the short head theory is no rocket science but I do take it seriously.
So I asked 2 people who know something about Tees.
Spacebar – my favorite popular threadless T-shirt
The first guy I asked was Jake Nickell, the founder and CEO of Threadless, my favorite T-shirt website. Threadless was founded back in 2000 after he won a t-shirt design contest. The site invites anyone in the world to submit their own T-shirt design. Then the Threadless community votes on the design and if it is chosen, it is offered for sale as t-shirts and other products on the site.
Jake told me that over the years Threadless received half a million designs for T-shirts!
Only 500 of them were actually printed.
99% of the designs that are submitted don’t feel the fabric of a T-shirt. They just get covered with dust in a back hard drive somewhere.
In other words, Threadless doesn’t even offer the long tail for sale!
That is not all – within the 5,000 designs they do print the distribution is like this:
1.33% of the Tees generate 20% of the sales.
8% of the Tees generate 50% of the sales.
30% of the Tees generate 80% of the sales.
The last 70% of the Tees generate only 20% of the sales.
Classic short head!
The share of revenues as a function of the number of Tees
This is what the graph would probably look like if they had printed all 500,000 different designs that were ever submitted.
The share of revenues as function of the number of potential Tees
The situation is quite similar at bustedtees.com, another online t-shirt store I like.
This is what Josh Abramson, the CEO of Bustedtees told me: “For t-shirts I think we’re probably still close to that 20% of the shirt produces 80% of the revenue…. I’ve been doing this stuff for 14 years since starting CollegeHumor in 1999 — both of our businesses are certainly driven by hits… That being said, we still have a nice benefit from having a big catalog to take advantage of the long tail as well… “.
So why doesn’t the long tail work here?
There are several reasons.
First of all, most of us, consumers, love popular stuff (as we can learn from the chart). We are not really that unique and special. We want Hits! This is one of the basic short head basics. We do however appreciate a site that offers us a nice variety and an option to browse.
Even if we are unique and feel like browsing for that something special, there is a limit to our ability to deal with too much information and variety. How much time do we want to spend on a T-shirt catalog searching for a…T-shirt? Or as Josh from Bustedtees suggested: “Hits have become more and more important in a world with so much noise online”.
As for the online store, dealing with thousands of designers requires a lot of resources. True, it doesn’t take much Database space, but it does requires resources and attention. You need to manage the monthly billing and payment to all of them, offer support, customer relations etc. it can be done but why bother if almost nobody wants to buy it?
The long tail is not economical as we once thought – the revenues that we can generate out of it don’t really worth it and it is much more efficient to focus on the hits!
DAFT DROID – My favorite popular bustedtees T-shirtby
So we have seen that the movie industry has set some incredible records in the last several years (read more here), and that the word of mouth, which is a fundamental reason for the short head, works overtime when it come to movies (read more here).
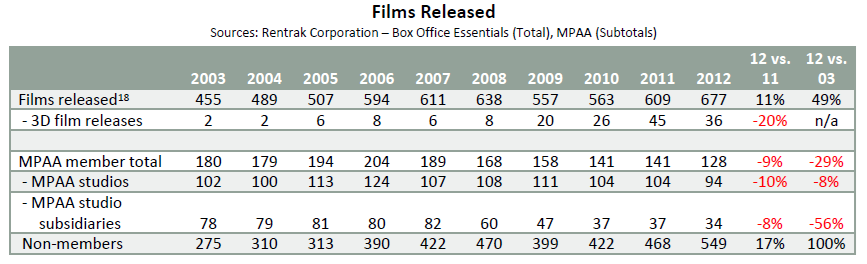
Now let’s fly a little higher and check some more macro aspects of the movie industry. For that purpose we shall take a look into the Theatrical Market Statistics 2012 that were published by the MPAA (motion picture association of America).
First of all it is good to know, especially for those in the movie industry, that the revenues are going up and that so is the number of digital screens and the price of an average movie ticket – the growth is bigger out side of the US but also domestic we see that the numbers go up.
Global Box Office – All Films (US$ Billions) / source: Theatrical Market Statistics 2014, MPAA
But this is not what we are here for. We are here to check on the short head of the movies and see if and how the film makers react to it. The best way to learn about it is by checking the number of movies that were produced and released each year.
Oops.
In 2012, 677 movies were released in domestic theaters. This is a boost of 11% from 2011 and 49% from 2003.
Is this the sound of a tail getting longer?
Let’s go deeper.
549 of The 677 movies that were released in 2012 are non-members movies. Only 128 movies were released by MPAA members. MPAA members are the big 6 studios (Walt Disney Studios Motion Pictures, Paramount Pictures Corporation, Sony Pictures Entertainment, Inc. Twentieth Century Fox Film Corporation, Universal City Studios LLC, and Warner Bros. Entertainment Inc.) and their subsidiaries.
If we look at the number of movies that the MPAA members released over the years the picture is different – their 128 movies that were released in 2012 are a huge decrease from 141 in 2011 (9%) and from 180 in 2003 (29%).
In 2013 the number went down to 114 movies (in 2014 it got back up to 136).
The big studios are making fewer movies year after year and in the meantime the small studios have doubled their releases in the last 10 years.
It seems like the big 6 studios fully understand and follow the rules of the short head scene while the small studios are still reading the book about the long tail.
But who says that the big studios are right? Maybe there is a long tail in the movies and they don’t know it?
Mmmm. Don’t think so.
The pareto of Hollywood
So I looked into box office mojo again and checked all the revenues of all the studios and all the movies that were playing in 2012.
According to BOM (box office mojo) the top 7 studios (the 6 MPAA members and Lionsgate which is the biggest independent studio) had 205 movies in 2012 (156 new and 49 that were released in 2011 and still running).
These 205 movies made all together almost 10 billion dollars in 2012. Bear in mind that not all of their movies were hits. They had some major flops but they still managed to get almost 10 billion dollars (domestic).
All 802 movies that were playing in 2012, according to BOM, made less than 11 billion dollars. That means that the big 7 studios were responsible for more than 90% of the revenues!
7.69% of the studios, who had movies that were playing in 2012, took almost 100% of the revenues.
The other 92.3% of the studios hardly made any revenues…
The top grossing 10 movies in 2012 were responsible for 30% of the revenues. That means that 1.5% of the movies that were playing in 2012 made 30% of the revenues.
3.6% of the movies played in 2012 made more than 50% of the revenues.
Less than 15% of the movies made more than 90% of the revenues!
The market share (in revenues) of the different movies / source – box office mojo
This is a nice short head but maybe it has always been this way?
So I turned back to BOM and checked the numbers of 2002.
Did the revenue split differently back then?
Apparently there was already a short head back then. The short head of 2012 seems only a bit bigger than the one in 2002.
But when we examine the market share (in revenues) as a function of the movies share (not the absolute 100 movies but the 15% of the movies that were published in the year) the picture is far more dramatic.
While in 2012 3.6% of the movies made 50% of the revenues, in 2002 it took almost 6% of the movies to reach 50% of the revenues.
While in 2012 14.3% of the movies made more than 90% of the revenues, in 2002 14.3% of the movies made less than 80%.
The market share (in revenues) of the top grossing 100 movies / source – box office mojo
It appears that the movie industry has shifted towards the short head, leaving the long tail to the small and medium studios. These small studios are still making more and more movies, trying and sometime succeeding to make a hit, but their revenues as whole are almost meaningless (sounds like what is happening to the long tail musicians… they tour much more than the popular artists but make less revenues – read more here).
The big studios are making fewer films, investing more and more money in each of them; they know that at this era all they need is a small amount of huge hits.
“Taking notice of changing industry economics and shifting consumer tastes has been modifying that blueprint. His strategy involves making fewer but more ambitious movies”. that is The New York Times wrote in 2010 about Jeff Robinov, the former president of the Warner Brothers Pictures Group.
Steven Spielberg recently explained that in a panel at the University of Southern California that: “We can’t expand the week. We can’t expand the 24-hour cycle. So we’re stuck with so many choices. You’re at the point right now where a studio would rather invest $250 million in one film for a real shot at the brass ring, than make a whole bunch of really interesting, deeply personal — and even maybe historical — projects that may get lost in the shuffle because there’s only 24 hours”.
Spielberg, by the way, doesn’t think that this strategy will prevail: “There’s going to be an implosion where three or four or maybe even half a dozen of these mega-budgeted movies are going to go crashing into the ground and that’s going to change the paradigm again”.
But the short head isn’t a paradigm. It is a profound change in our economy – in the demand and supply. The consumers, or at least most of them, in this case the moviegoers, don’t really want a long tail. They want hits. On the other side we have the suppliers, in this case the studios, who are doing what is right for them – focus on a small amount of potential hits and meeting the demand.
If one or more studios would fall in the process it probably won’t really change a thing.
A parade of turkeys from the 1922 Cuero Turkey Trot / source: www.turkeyfest.org
The death of Vilfredo Federico Damaso Pareto in August 1923 didn’t have much impact on the people of Cuero, a small town in Texas, USA.
They were busy getting ready for their annual “Turkeyfest“, a parade in which more than 30,000 people come to see 20,000 turkeys march together down the Main Street of their town, dancing and enjoying with big band music.
Another reason for not grieving over the death of Paretto was that they didn’t really know the guy who died more than 5,000 miles away in Switzerland.
What they also didn’t know was that a few blocks away from the Turkey parade route that was covered with feathers and crumbs of corn, and 3 years later, Frank Bass would be born.
Frank Bass grew up in Cuero, and after graduation he had to decide if he wants to be a cowboy or a professor. The decision was hard. “Cowboys dominate on the honesty dimension, but they are, perhaps, slightly more intelligent than professors. Alas, however, professors make a lot more money than cowboys” He said.
Luckily to the marketing profession he chose to be a professor.
Today he is known as the creator of the Bass diffusion model, which was first introduced in 1963.
Bass diffusion model is one of the solid bases and explanations of the short head theory.
The origins of the Bass diffusion model
In 1962, Professor Everett M. Rogers gave a lecture at Purdue University, where Professor Bass was teaching at that time.
It was a few months after Rogers, who was a professor of rural sociology, published his book “Diffusion of innovations“.
“Diffusion of innovations” tried to explain how innovations (new ideas, objects etc.) are being spread through the communication channels over time and among the members of a social system.
The “spreading” is done by word of mouth and the reason why it is so important is that “new” things are perceived as risky and uncertain. People try to lower the risk by seeking out others like themselves who have already adopted the innovation.
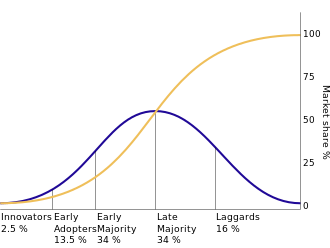
Therefore the diffusion process starts with the innovators, then the early adaptors, who adopt innovation and then spread the word further until the innovation gets to a critical mass.
The diffusion of innovations according to Rogers / source: Wikipedia
The book was one of the first attempts to understand how we adopt innovation, a subject that engaged Frank Bass as well.
After Professor Roger gave his speech at Purdue University, one of Frank’s students came to him and asked if there was a way to express the idea of imitators and innovators that Rogers talked about, mathematically.
Frank took a pen and started scratching an answer, a mathematical model that would describe the “Diffusion of innovations” – it didn’t take him long to come up with one.
It did, however, take him another 5 years to write a complete paper that provided empirical support for his model.